Logo
Departments
Resources
About Us
Contact Us
News
Sustainability

Business Travel Emissions: The Hidden Data Gaps Putting Your Carbon Report at Risk

April 14, 2026
www.predictx.com/resources/business-travel-emissions-scope3-data-gaps
www.predictx.com/resources/travel-and-expense-data-analytics-the-agentic-ai-shift
www.predictx.com/resources/travel-and-expense-management-predictx-solutions
www.predictx.com/resources/corporate-travel-carbon-reporting-data-quality
www.predictx.com/resources/agentic-ai-travel-management-modern-edge-t-e
www.predictx.com/resources/predictx-global-conflict-module-corporate-travel-risk-management
www.predictx.com/resources/future-global-travel-expense-management-ai
www.predictx.com/resources/continuous-air-sourcing-travel-and-expense-data
www.predictx.com/resources/travel-data-predictive-analytics-net-zero-targets
www.predictx.com/resources/agentic-ai-air-sourcing-imperative
www.predictx.com/resources/audit-ready-reporting-data-chain-of-custody-tne
www.predictx.com/resources/predictx-ai-rubicon-te-reporting-sustainability
www.predictx.com/resources/whitepaper-modal-shift-co2e-savings-audit-ready-p1
www.predictx.com/resources/csrd-scope3-business-travel-emissions-compliance
www.predictx.com/resources/predictx-wins-major-business-travel-technology-innovation-award-t-ereporting
www.predictx.com/resources/btsa-2025-ai-commitment-gap-t-e-reporting-agentic-ai
www.predictx.com/resources/complete-guide-air-sourcing-navigator-agentic-ai-corporate-travel-managers-t-e
www.predictx.com/resources/continuous-air-sourcing-ai-solution-travel-managers-travel-expense
www.predictx.com/resources/audit-ready-esg-compliance-travel-emissions-data-product-sheet
www.predictx.com/resources/air-sourcing-navigator-agentic-ai-product-sheet
www.predictx.com/resources/predictx-in-focus-1-agentic-ai-auditable-sustainability-and-the-future-of-elite-t-e-reporting
www.predictx.com/resources/the-future-proof-travel-program-ensuring-agility-with-advanced-business-intelligence
www.predictx.com/resources/the-5-solution-ai-fluency-blueprint-cogent-agentic-ai
www.predictx.com/resources/ai-project-root-causes-strategic-data-cogent-agentic-ai
www.predictx.com/resources/ai-failure-mcdonalds-aircanada-t-e-reporting-cogent-agentic-ai
www.predictx.com/resources/keesup-choe-btn-interview-cogent-agentic-ai-predictx
www.predictx.com/resources/corporate-travel-sustainability-car-rental-emissions
www.predictx.com/resources/what-to-ask-your-ai-prompts-cogent-agentic-ai
www.predictx.com/resources/the-last-mile-corporate-carbon-footprint-ghg-compliance
www.predictx.com/resources/how-agentic-ai-powers-t-e-reporting-rag
www.predictx.com/resources/predictx-squake-master-last-mile-emissions-esg-compliance
www.predictx.com/resources/beyond-dashboards-the-agentic-ai-revolution-in-t-e-reporting-expense-audit
www.predictx.com/resources/2025-playbook-for-net-zero-business-travel-by-predictx-squake-actionable-sustainability
www.predictx.com/resources/t-e-manager-tomorrow-cogent-agentic-ai-corporate-travel
www.predictx.com/resources/predictx-squake-audit-ready-co2-reporting
www.predictx.com/resources/introducing-predictx-in-focus-newsletter-your-corporate-travel-data-advantage
www.predictx.com/resources/cogent-tech-hotlist-agentic-ai-travel-and-expense
www.predictx.com/resources/prompt-engineering-cogent-agentic-ai-guide-t-and-e
www.predictx.com/resources/keesup-choe-agentic-ai-cogent-travel-expense
www.predictx.com/resources/product-sheet-cogent-ai-powered-travel-and-expense-t-e-reporting
www.predictx.com/resources/6-powerful-cogent-use-cases-for-t-e-reporting-travel-data
www.predictx.com/resources/cogent-wins-2025-bts-europe-innovation-faceoff
www.predictx.com/resources/transform-t-e-management-with-cogents-ai-powered-solutions
www.predictx.com/resources/predictx-squake-sustainability-travel-management
www.predictx.com/resources/unlocking-net-zero-goals-in-corporate-travel-insights-from-predictx-at-itm-sustainability-showcase-2024-webinar
www.predictx.com/resources/accelerating-towards-net-zero-a-guide-for-corporate-travel-managers
www.predictx.com/resources/unveiling-predictxs-internal-carbon-pricing-tool-a-transformative-leap-for-business-travel-sustainability
www.predictx.com/resources/how-ai-can-help-track-and-reduce-your-companys-travel-emissions
www.predictx.com/resources/defining-success-the-north-star-metric-for-business-travel-managers
www.predictx.com/resources/enhancing-corporate-travel-management-with-predictx-scorecard-a-comprehensive-solution
www.predictx.com/resources/understanding-compliance-and-risk-in-corporate-travel
www.predictx.com/resources/internship-journey-at-predictx-a-blend-of-learning-growth-and-inspiration
www.predictx.com/resources/unlocking-the-power-of-data-in-corporate-travel-discover-the-story-by-predictx
www.predictx.com/resources/effective-meetings-and-events-management-in-corporate-travel
www.predictx.com/resources/optimizing-corporate-card-usage
www.predictx.com/resources/adhering-to-the-csrd-shaping-the-future-of-corporate-travel-sustainability-with-predictx
www.predictx.com/resources/optimizing-spend-amidst-record-corporate-travel-industry-growth-in-2024
www.predictx.com/resources/the-simulation-engine-showcases-at-btn-us-innovate-2021
www.predictx.com/resources/how-to-promote-sustainability-and-calculate-your-companys-carbon-footprint
www.predictx.com/resources/spend-less-time-managing-cross-border-activities
www.predictx.com/resources/stay-on-top-of-tax-compliance
www.predictx.com/resources/keep-up-to-date-with-pre-trip-data
www.predictx.com/resources/manage-employee-generated-spend
www.predictx.com/resources/scorecard-for-travel-and-expense-management
www.predictx.com/resources/tickets-refunds-and-asset-recovery
www.predictx.com/resources/spend-reporting-made-simple
www.predictx.com/resources/sourcing-and-policy-management
www.predictx.com/resources/simulate-your-budget-with-predictx
www.predictx.com/resources/from-reactive-reporting-to-proactive-management
www.predictx.com/resources/hollywood-studio-transforms-the-analysis-process
www.predictx.com/resources/enhancing-travel-management-how-predictx-transformed-savings-analysis-for-a-european-retailer
www.predictx.com/resources/transforming-travel-data-enhancing-quality-and-efficiency-with-predictx
www.predictx.com/resources/predictx-for-susutainability
www.predictx.com/resources/predictx-for-egs
www.predictx.com/resources/predictx-for-travel
www.predictx.com/resources/predictx-uses-machine-learning-to-power-business-reporting
www.predictx.com/resources/merging-fragmented-travel-data-into-one-dynamic-system
www.predictx.com/resources/enhancing-traveler-satisfaction-and-employee-wellbeing-in-corporate-travel
www.predictx.com/resources/unify-corporate-travel-data-streamline-and-automate-with-predictx
www.predictx.com/resources/how-leakage-and-invisible-spending-influences-your-travel-program
www.predictx.com/resources/facilitate-smarter-travel-management-with-sheri-ais-cognitive-tools
www.predictx.com/resources/detectx-leveraging-ai-for-travel-expense-audit-compliance-customised-travel-policies
www.predictx.com/resources/calculate-your-total-trip-cost-with-predictx
www.predictx.com/resources/predictx-at-the-business-travel-show-europe-2024-a-showcase-of-innovation-and-insight
www.predictx.com/resources/why-data-management-is-important-to-your-business-travel-program
www.predictx.com/resources/how-ai-will-completely-transform-corporate-travel-and-the-role-of-the-travel-manager-forever
www.predictx.com/resources/how-predictx-is-pioneering-the-use-of-ai-for-corporate-travel-sustainability
www.predictx.com/resources/the-future-of-ai-in-air-sourcing-how-predictxs-navigator-transforms-data-into-decisions
Business travel emissions data gaps across hotels, ground transport, and flights for Scope 3 carbon reporting

What are business travel emissions?

Business travel emissions are the greenhouse gases produced by employee travel in vehicles and accommodation not owned or operated by the reporting company, classified under Scope 3 Category 6 of the GHG Protocol.

Most corporate carbon reports are wrong. Not by a small margin. If your data comes from flight bookings alone, you are missing entire categories of emissions that CSRD auditors are now required to check.

Hotels. Ground transport. Rail. None of them live in your TMC platform. They sit in fragmented expense lines, unprocessed folios, and miscellaneous spend categories that standard carbon tools never reach. According to Transport & Environment, 85% of global companies lack credible plans to reduce their corporate flying emissions. The root cause is not ambition. It is architecture: most organisations are not measuring the full trip.

This guide explains where calculating Scope 3 emissions from business travel breaks down, what data each category actually requires, and how consolidated T&E data closes the gap for audit-ready CSRD reporting.

In This Article

  1. Why are business travel emissions so hard to report accurately?
  2. Why is hotel data the biggest gap in Scope 3 carbon reporting?
  3. What makes ground transport emissions so difficult to capture?
  4. How does the PredictX 4-Layer Data Chain work?
  5. How does consolidated T&E data produce audit-ready Scope 3 reporting?
  6. Frequently Asked Questions

Why are business travel emissions so hard to report accurately?

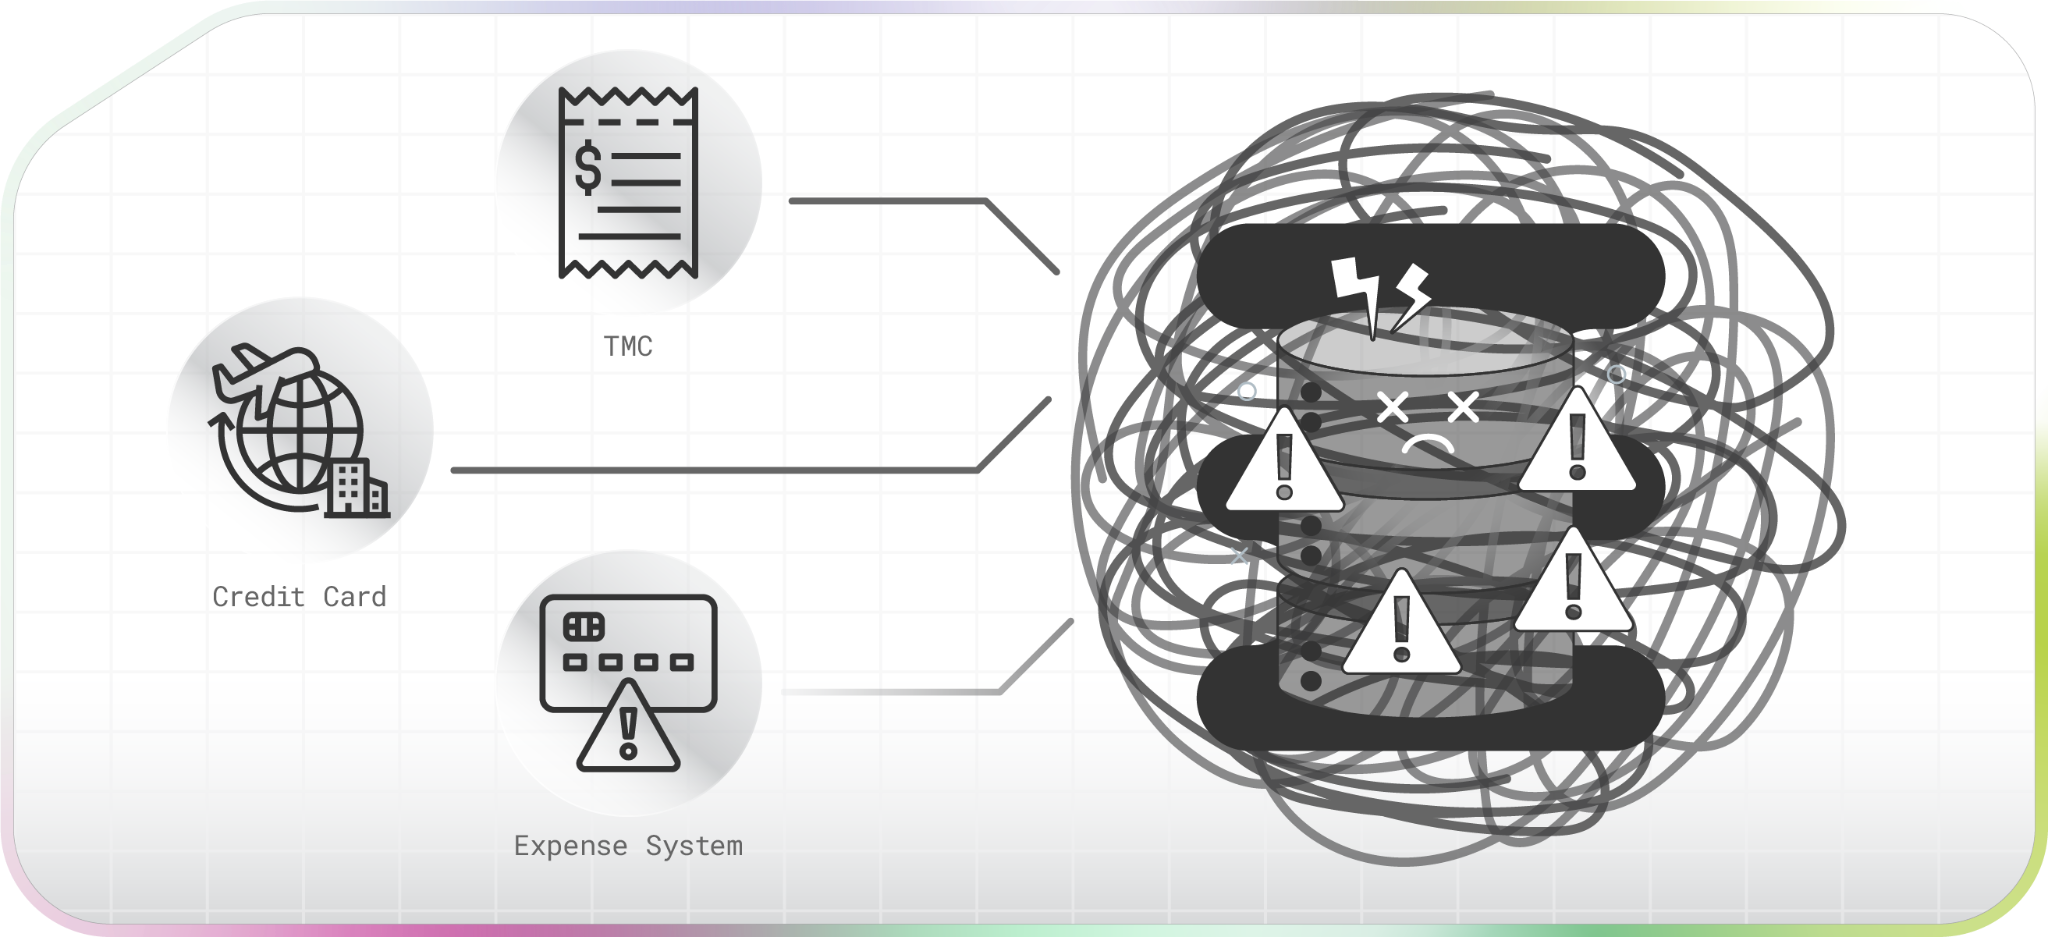
Business travel emissions are hard to report accurately because the data lives across multiple disconnected systems: TMC booking platforms, expense tools, hotel folios, and rail feeds. None of them connect by default.

Business travel emissions, also known as Scope 3 Category 6 emissions under the Greenhouse Gas Protocol, cover all greenhouse gas emissions from employee travel in vehicles or accommodation not owned by the company. The GHG Protocol explicitly includes flights, rail, car rental, taxis, and hotel stays. CSRD, the EU's Corporate Sustainability Reporting Directive, requires all of these to be reported with third-party assurance. A carbon report covering only flights fails that test.

Most travel management companies provide solid air data: route, cabin class, airline. The structural problem is that their data ends at the boarding gate. Everything before and after it sits somewhere else, or nowhere at all: the taxi to the airport, the hotel, the rental car, the ride-share from the station.

The IPCC Sixth Assessment Report confirms that Scope 3 can account for over 70% of a company's total carbon footprint. For organisations with active travel programmes, the gap between what they are reporting and what they are actually emitting is material.

"You cannot manage what you don't measure accurately. We deliver certified, auditable CO2 emission calculations aligned with frameworks like the GHG Protocol and CSRD." Keesup Choe, CEO, PredictX

The three data sources most companies rely on each carry a different blind spot in their ESG reporting:

Comparison of corporate T&E data sources for Scope 3 emissions reporting: what each captures and what it structurally misses
Data Source What It Captures What It Structurally Misses
TMC booking platform Flights, some rail bookings Hotels, ride-share, taxis, unmanaged ground transport
Expense system Hotel spend, taxi spend Property identity, distance, fuel type, grid intensity
Credit card feed All spend categories Every variable needed to calculate an emission factor

No single T&E data source provides full visibility. A unified analytics platform with a certified calculation engine is required for CSRD-compliant ESG reporting.

The scale of the problem in numbers:

Key statistics on business travel emissions, corporate aviation, and Scope 3 carbon reporting gaps, 2022 to 2024
Stat Figure Source Year
Companies without credible plans to cut flying emissions 85% Transport & Environment 2024
Business travel share of all global travel 15-20% World Resources Institute 2024
Growth in global commercial aviation CO2 (2013-2019) +30% (707Mt to 918Mt) ICCT 2022
CO2 reduction: train vs comparable flight (London-Paris) Up to 97% Eurostar 2024
Potential EU emissions cut if corporate travel reduced 50% by 2030 32.6 MtCO2e Transport & Environment 2024

Business travel is one of the highest-leverage Scope 3 categories a company can actually control, and one of the least accurately reported.

Three-column diagram showing TMC, expense system, and credit card data gaps in Scope 3 business travel emissions reporting
No single T&E data source captures the full trip. This diagram maps the structural blind spots across the three most common sources, showing why hotels and ground transport remain invisible to most carbon reports.

Why is hotel data the biggest gap in Scope 3 carbon reporting?

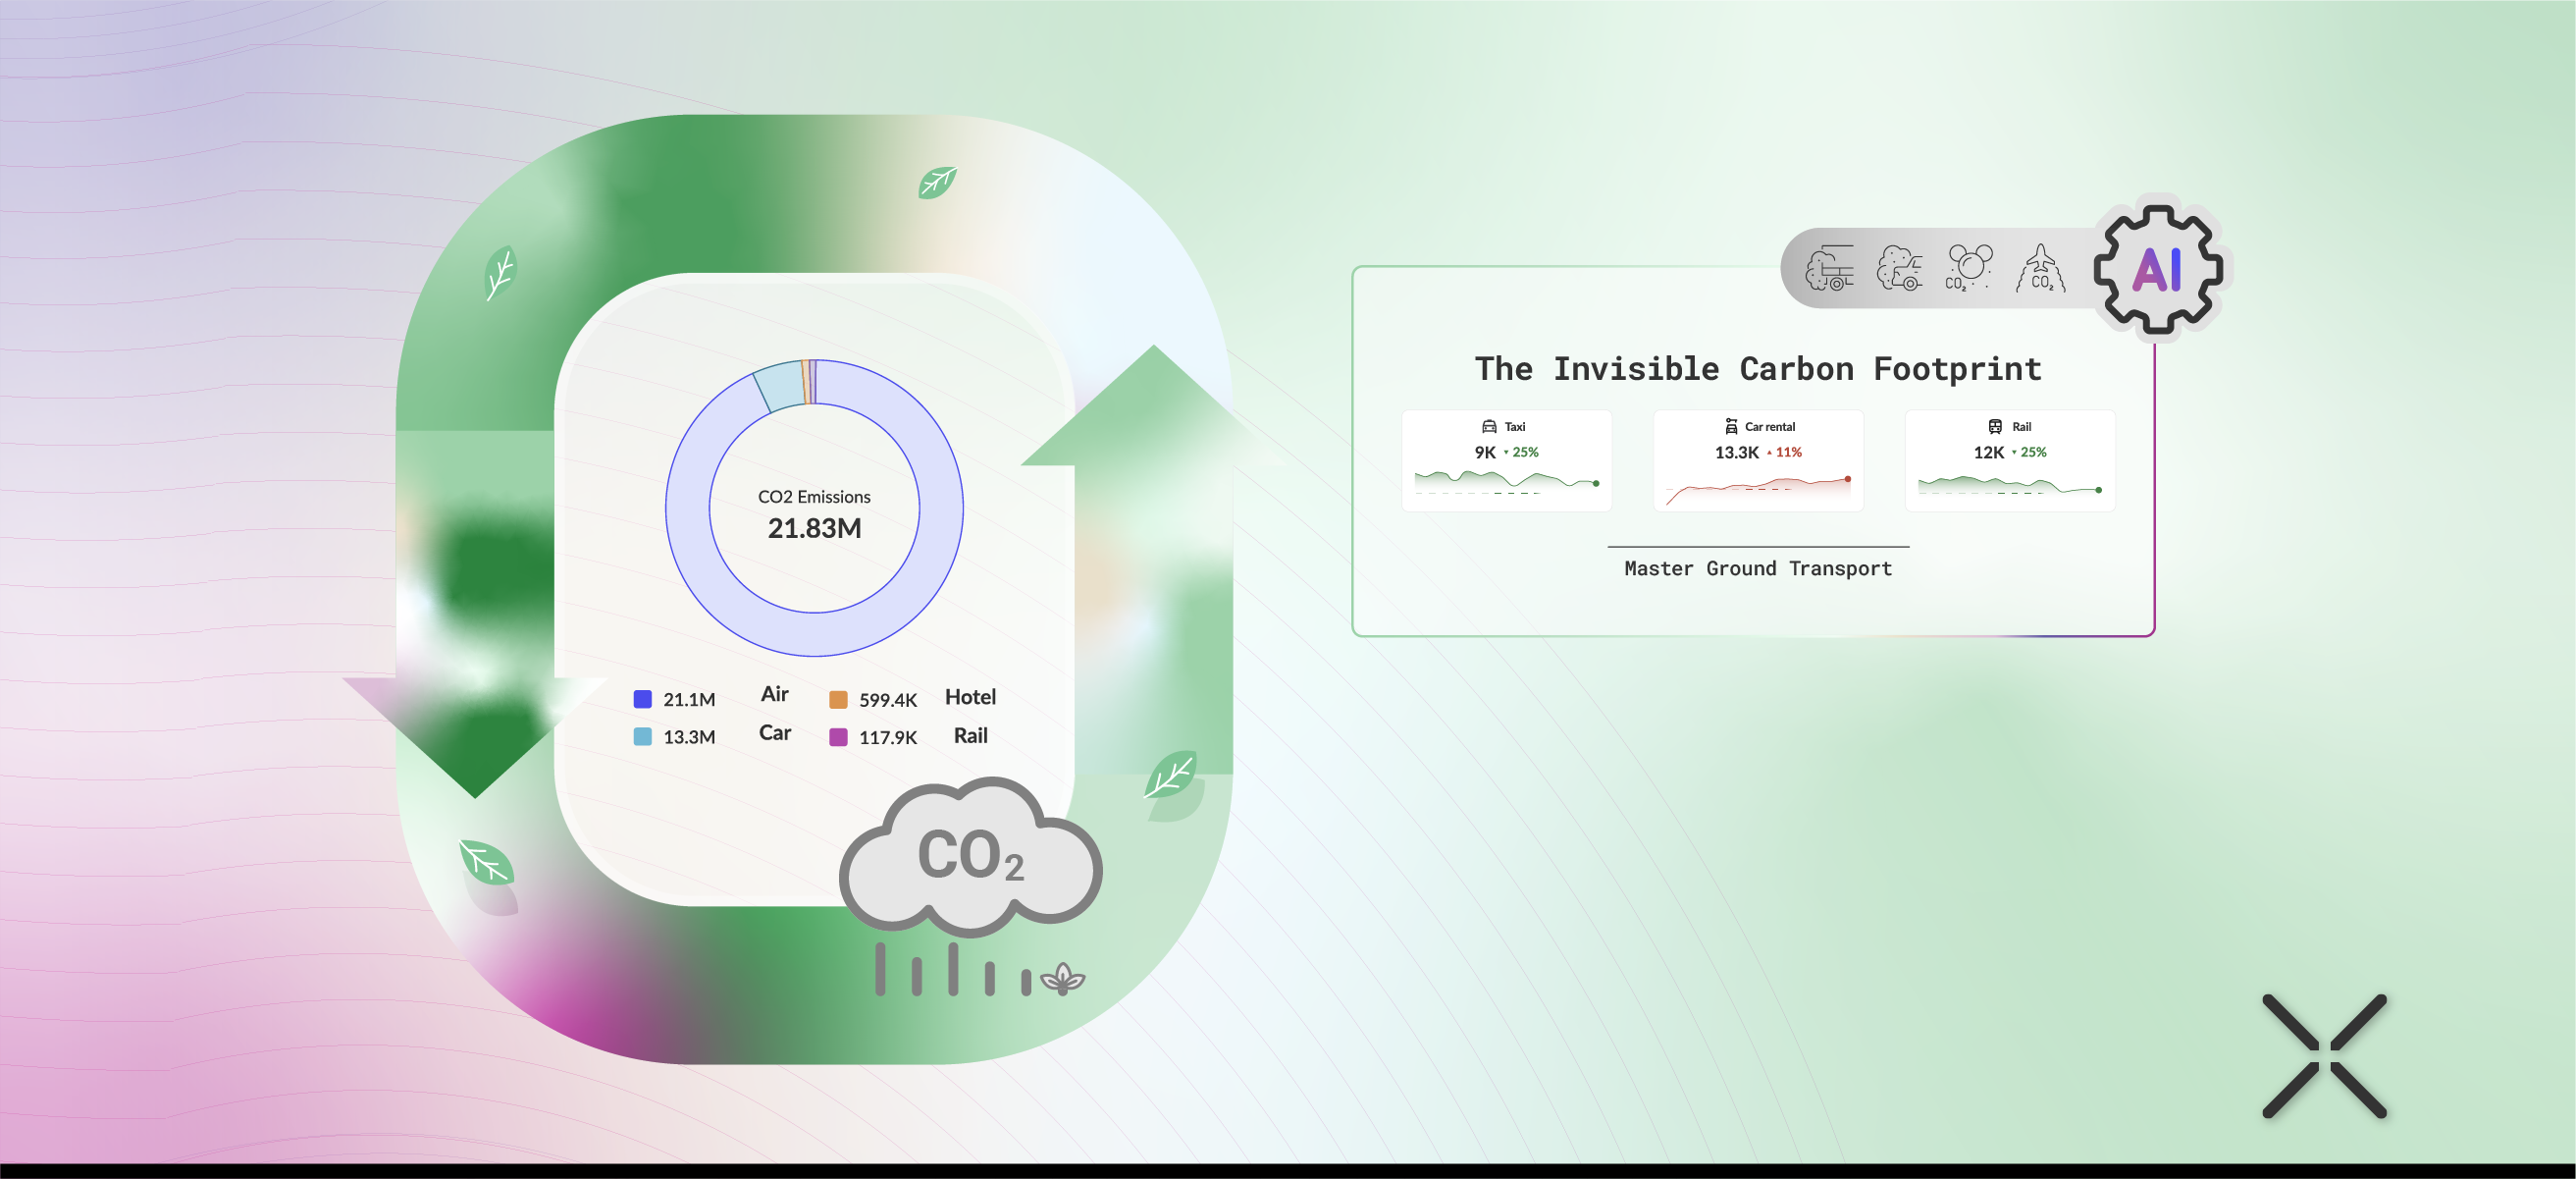
Hotel emissions are impossible to calculate from spend data alone because a credit card transaction contains none of the four variables an accurate hotel carbon footprint calculation requires.

To calculate hotel stay emissions to the standard required by the GHG Protocol and CSRD sustainability reporting, you need four things: the specific property (not just the brand), the number of nights, the regional energy grid carbon intensity, and ideally the hotel's own consumption data via the Hotel Carbon Measurement Initiative (HCMI). A "$300 at Marriott" expense line provides none of these.

The 4-Variable Hotel Emissions Gap

Each of these variables is genuinely necessary. None can be estimated from spend data alone.

1. Specific property identity. Brand name is not sufficient. Properties within the same chain vary in energy profile based on age, renovation history, and local infrastructure.

2. Number of nights. A spend figure without stay duration cannot produce a per-night emission factor. A $600 charge could be one night or three.

3. Regional grid carbon intensity. France's nuclear-heavy grid runs at around 35 g CO2e/kWh. Some European summer grids run above 330 g CO2e/kWh. Two hotels charging the same nightly rate in different countries can have emissions profiles differing by a factor of ten. Spend-based methods erase that difference entirely.

4. Hotel-reported energy data (HCMI standard). HCMI-standard property data is the most accurate source available. Spend-based estimates carry a 30 to 40% accuracy variance under the GHG Protocol's own guidance, which does not meet CSRD audit requirements.

Spend-Based vs Distance-Based: Which Method Is Your Scope 3 Report Using?

The GHG Protocol defines three methods for calculating business travel emissions. Most companies default to the least accurate one. Toggle below to see what each method delivers and what it costs you in audit readiness.

Spend-Based vs Distance-Based: Which Method Are You Using?

Toggle between the two GHG Protocol calculation methods to see what each delivers — and what it costs you in accuracy.

Spend-Based
Distance-Based
GHG Protocol Method 3
Spend-Based Method
Uses total spend as the emissions proxy
⚙️
How it works
Multiplies total travel spend by an average emissions factor derived from economy-wide input-output tables (EEIO). No trip-level data required.
📋
Data required
Total spend by travel category (flights, hotels, ground transport). Available from credit card feeds or expense systems.
🎯
Accuracy
Low — 30 to 40% variance. Cannot account for grid intensity, cabin class, fuel type, or property-level energy data. Two identical spend totals in different countries can produce emissions figures that differ by a factor of ten.
🔍
CSRD audit status
At risk
Accepted as a last resort under GHG Protocol, but the 30 to 40% accuracy variance is a material weakness. Third-party assurers under CSRD will flag it.
Best for
Organisations at the start of their Scope 3 journey with no trip-level data available. A starting point only — not a long-term reporting strategy.

PredictX applies distance-based methodology by default, with folio-level data extraction for hotels and agentic AI for ground transport.

Request a Trial →

The same problem applies to travel class. According to the Google Travel Impact Model, business class generates 1.5 to 4 times more CO2e per passenger than economy, and first class generates 1.5 to 5 times more. On wide-body aircraft, premium seats account for roughly 35% of total flight emissions while occupying a fraction of the seats. A report treating all cabin classes equally is undercounting in two directions at once.

The real data sits in hotel folios, the itemised checkout bills, which travel programmes almost never capture systematically. Folios get photographed, uploaded as expense attachments, manually categorised as "accommodation," and stripped of every variable a credible CO2 calculation needs. Without an audit-ready T&E data chain of custody platform that extracts and enriches folio-level data, spend-based estimates with 30 to 40% accuracy variance are the only alternative. That is not auditable under CSRD.

Side-by-side comparison of a hotel expense line showing only spend versus a hotel folio with property, nights, and grid intensity data highlighted
A "$300 at Marriott" expense line contains none of the four variables required to calculate hotel emissions accurately. Hotel folios carry the data, but most corporate travel programmes never capture them systematically.

What makes ground transport emissions so difficult to capture?

Ground transport is the most fragmented Scope 3 emissions category because car rentals, rail, and ride-sharing each require completely different data inputs, and each breaks down differently inside standard expense systems.

Rail travel is the obvious sustainable alternative, and the numbers back that up. A London to Paris journey via Eurostar produces around 2 kg CO2e per passenger versus approximately 61.5 kg CO2e by plane, a 97% reduction according to Eurostar's sustainability reporting. Across European routes broadly, aviation emits five to six times more CO2 per passenger kilometre than high-speed rail. Air vs rail modal shift is one of the highest-leverage CO2 reduction strategies available to corporate travel managers today.

Rail demand is growing fast. EU rail passenger transport reached 429 billion passenger-kilometres in 2023, an 11.2% year-on-year increase according to Eurostat. That volume of rail trips needs to appear in Scope 3 calculations, not disappear into unstructured expense lines.

Rail emissions still need to be tracked, though. Grid intensity varies by operator and by time of day. Route-specific rail data is what separates a defensible modal shift claim from an unverifiable one.

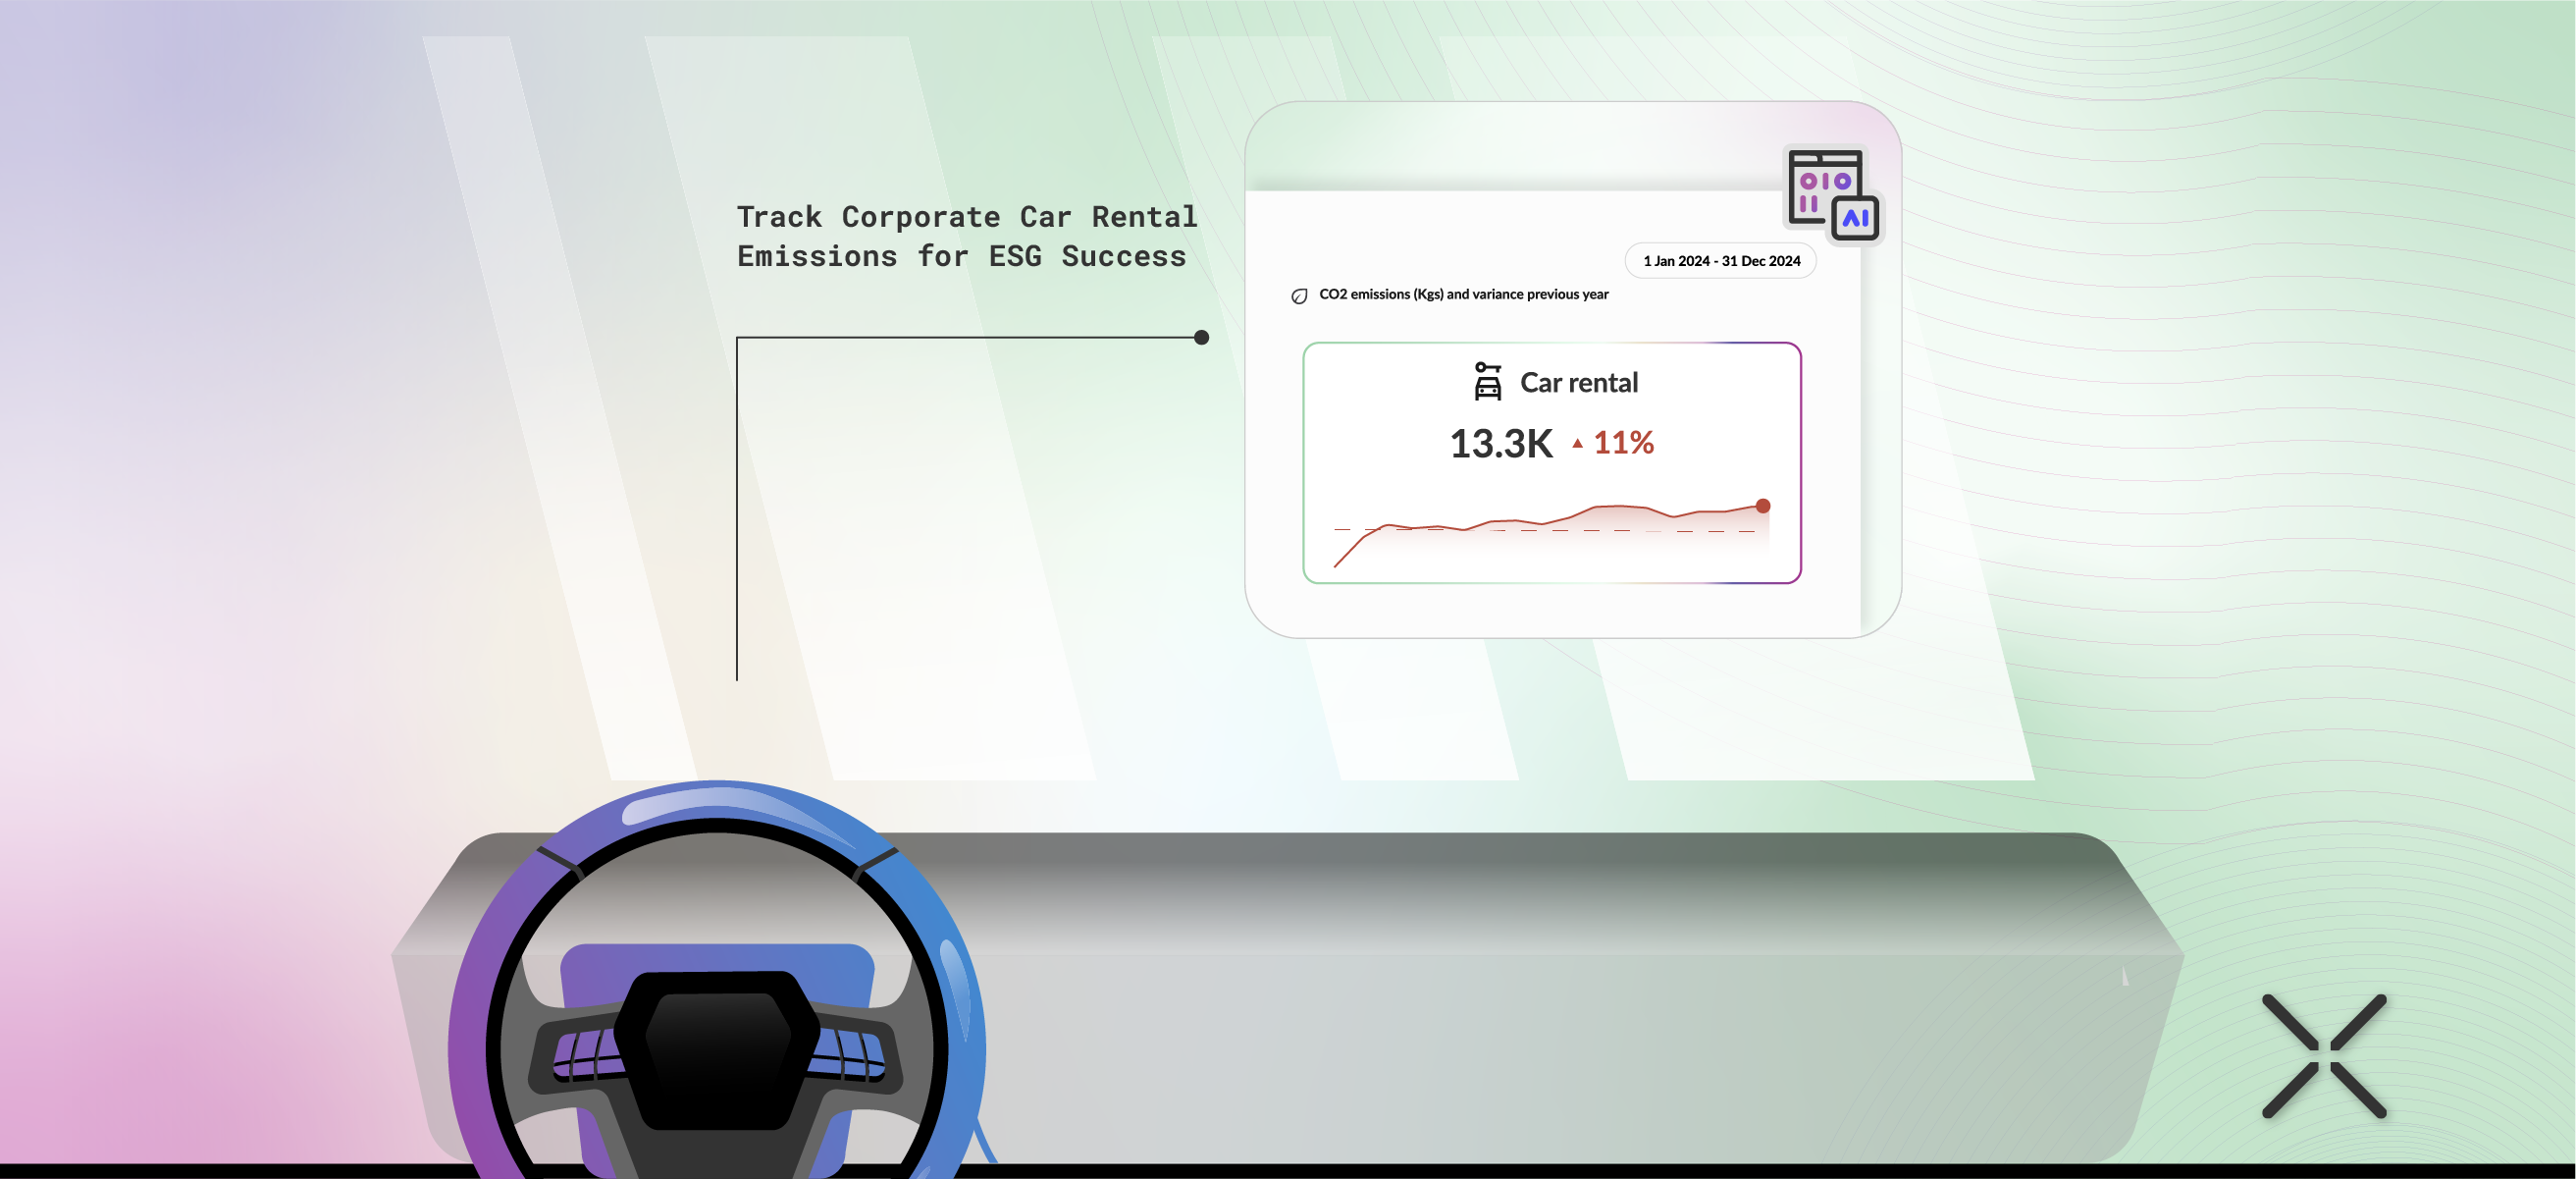
Car rentals present a separate problem. Calculating ground transport emissions requires car type, fuel type, and distance driven. A rental for "4 days" on a credit card statement contains none of that. An electric vehicle and a petrol saloon in the same booking class can have a three-times emissions difference. The PredictX guide to car rental emissions trackingcovers how to close this gap using integrated T&E data.

Taxis and ride-share are the highest-volume ground transport category in most travel programmes and the hardest to capture. Many are paid personally and claimed via expenses as miscellaneous spend. No distance. No vehicle type. No fuel data.

Ground transport emissions data gaps by type: what expense systems capture versus what Scope 3 carbon footprint calculations require
Transport Type Data Typically in Expense System Emissions Inputs Actually Required
Car rental Supplier, total spend, rental days Car type, fuel type, kilometres driven
Rail Booking reference (sometimes) Operator, route, regional grid energy mix
Taxi and ride-share Total spend only Distance, vehicle type, city-level fuel factors

Spend data alone cannot produce a defensible ground transport emissions figure under GHG Protocol or ISO 14083 methodology.

"The complexity of ground transport data is exactly why off-the-shelf carbon tools fall short. Route, fuel type, and grid mix are not optional variables. They are the calculation." Philipp von Lamezan, CEO and Co-founder, SQUAKE

Bar chart showing total business trip CO2 emissions split across air travel, hotel stays, car rental, and ride-share with missing categories highlighted
Air travel dominates most corporate carbon reports, but hotels and ground transport account for a significant share of the total trip carbon footprint. For companies subject to CSRD reporting, these categories cannot be omitted.

How Does the PredictX 4-Layer Data Chain Work?

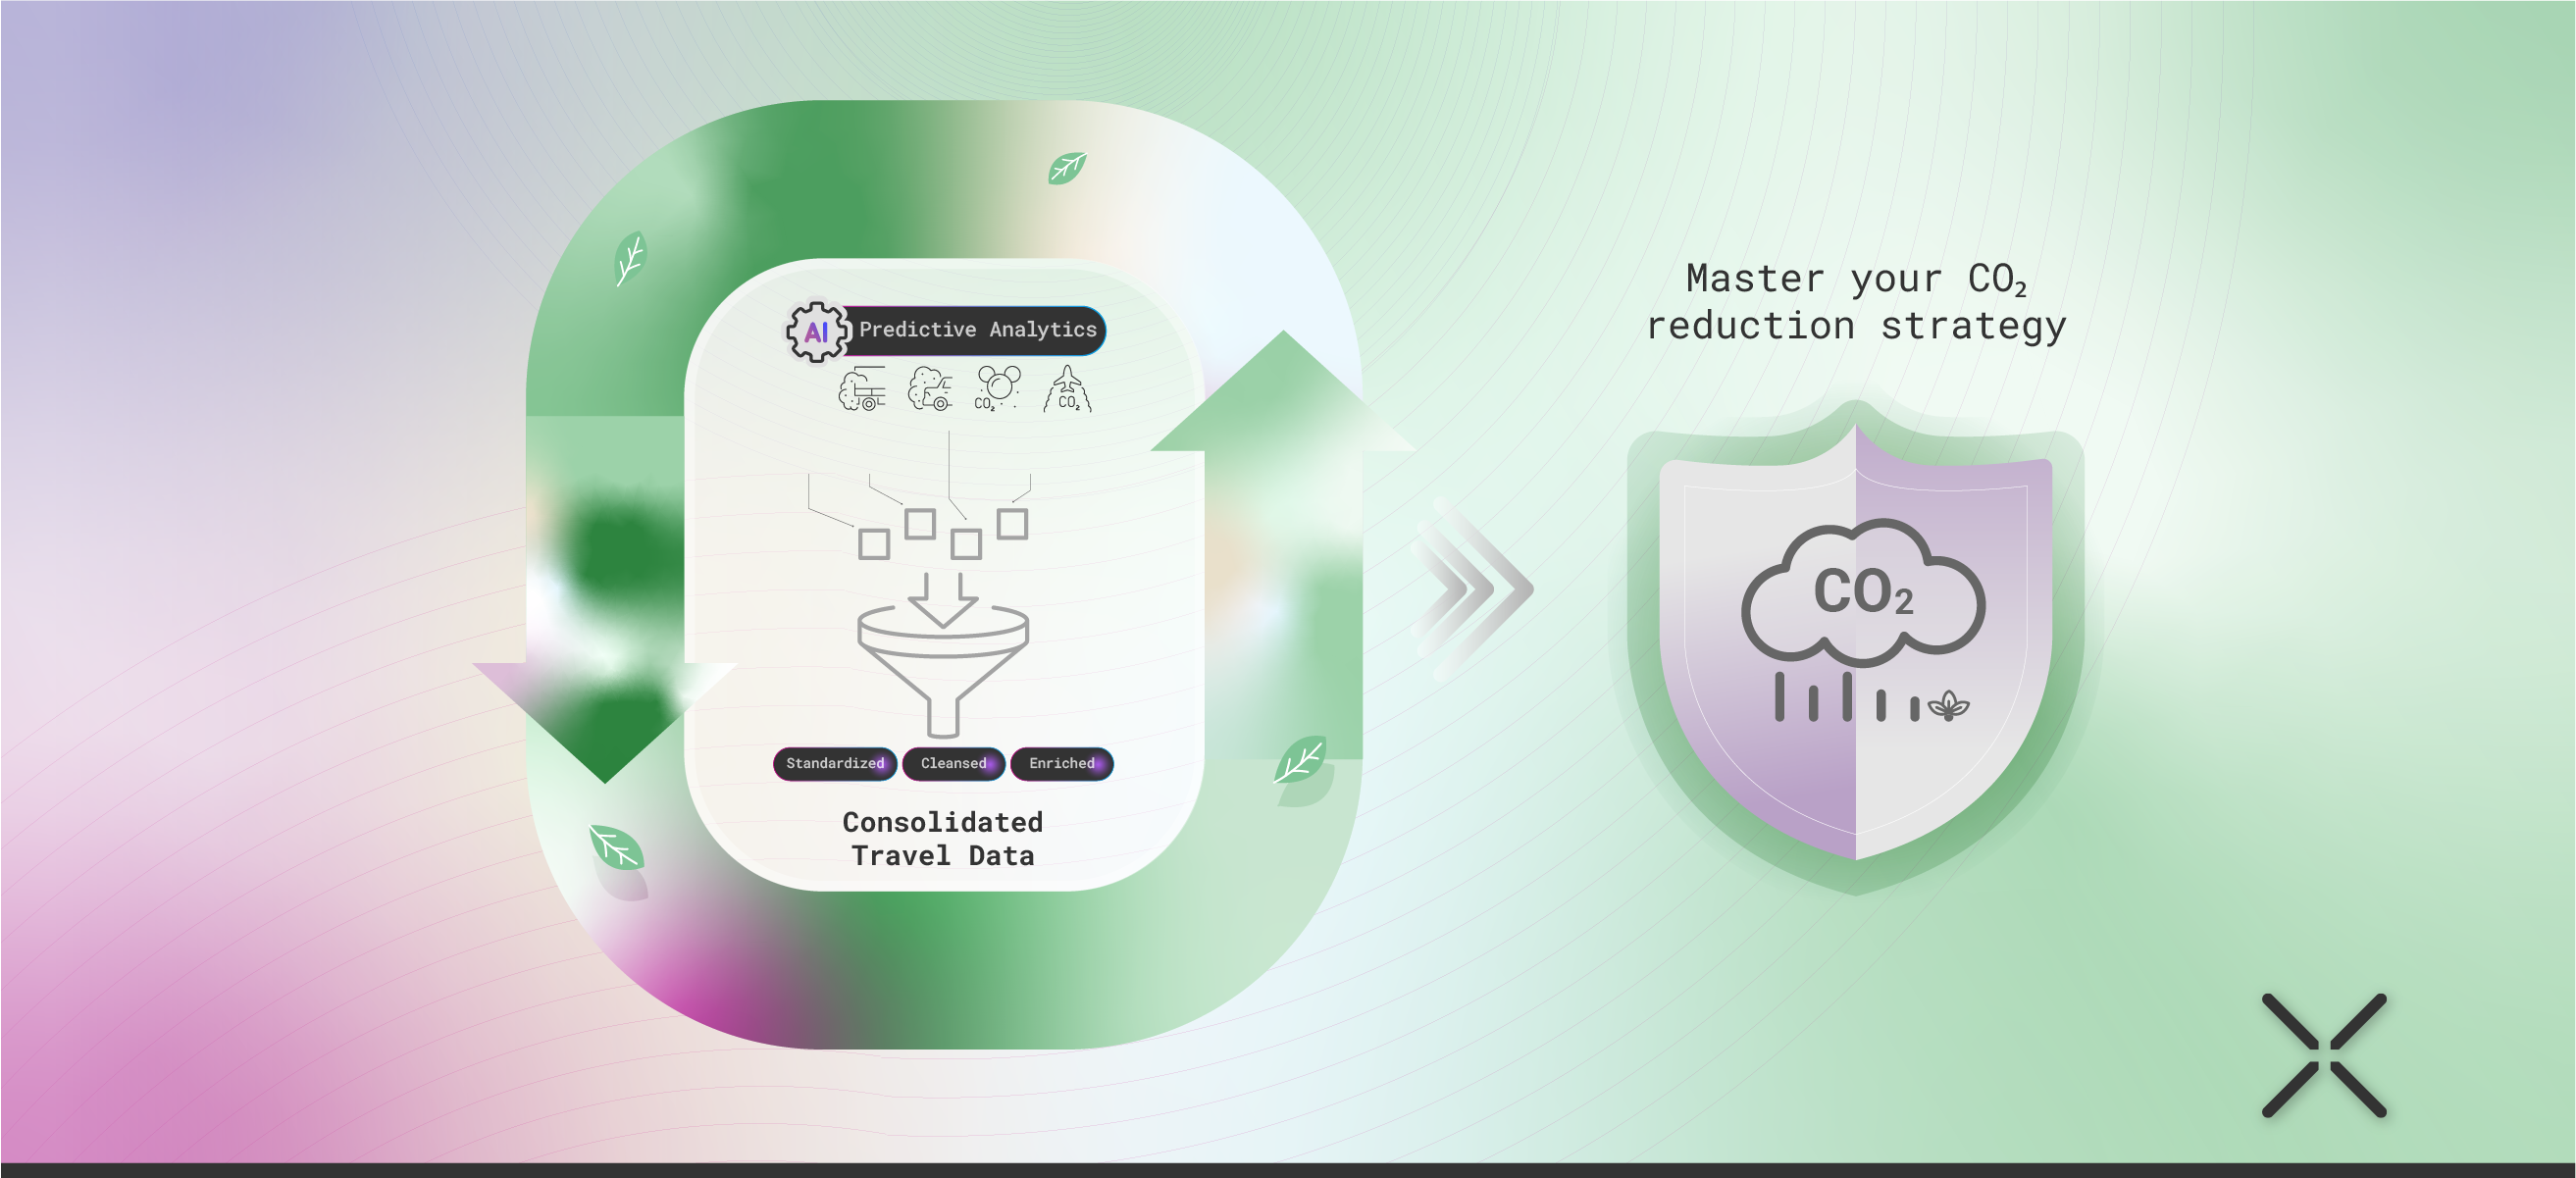
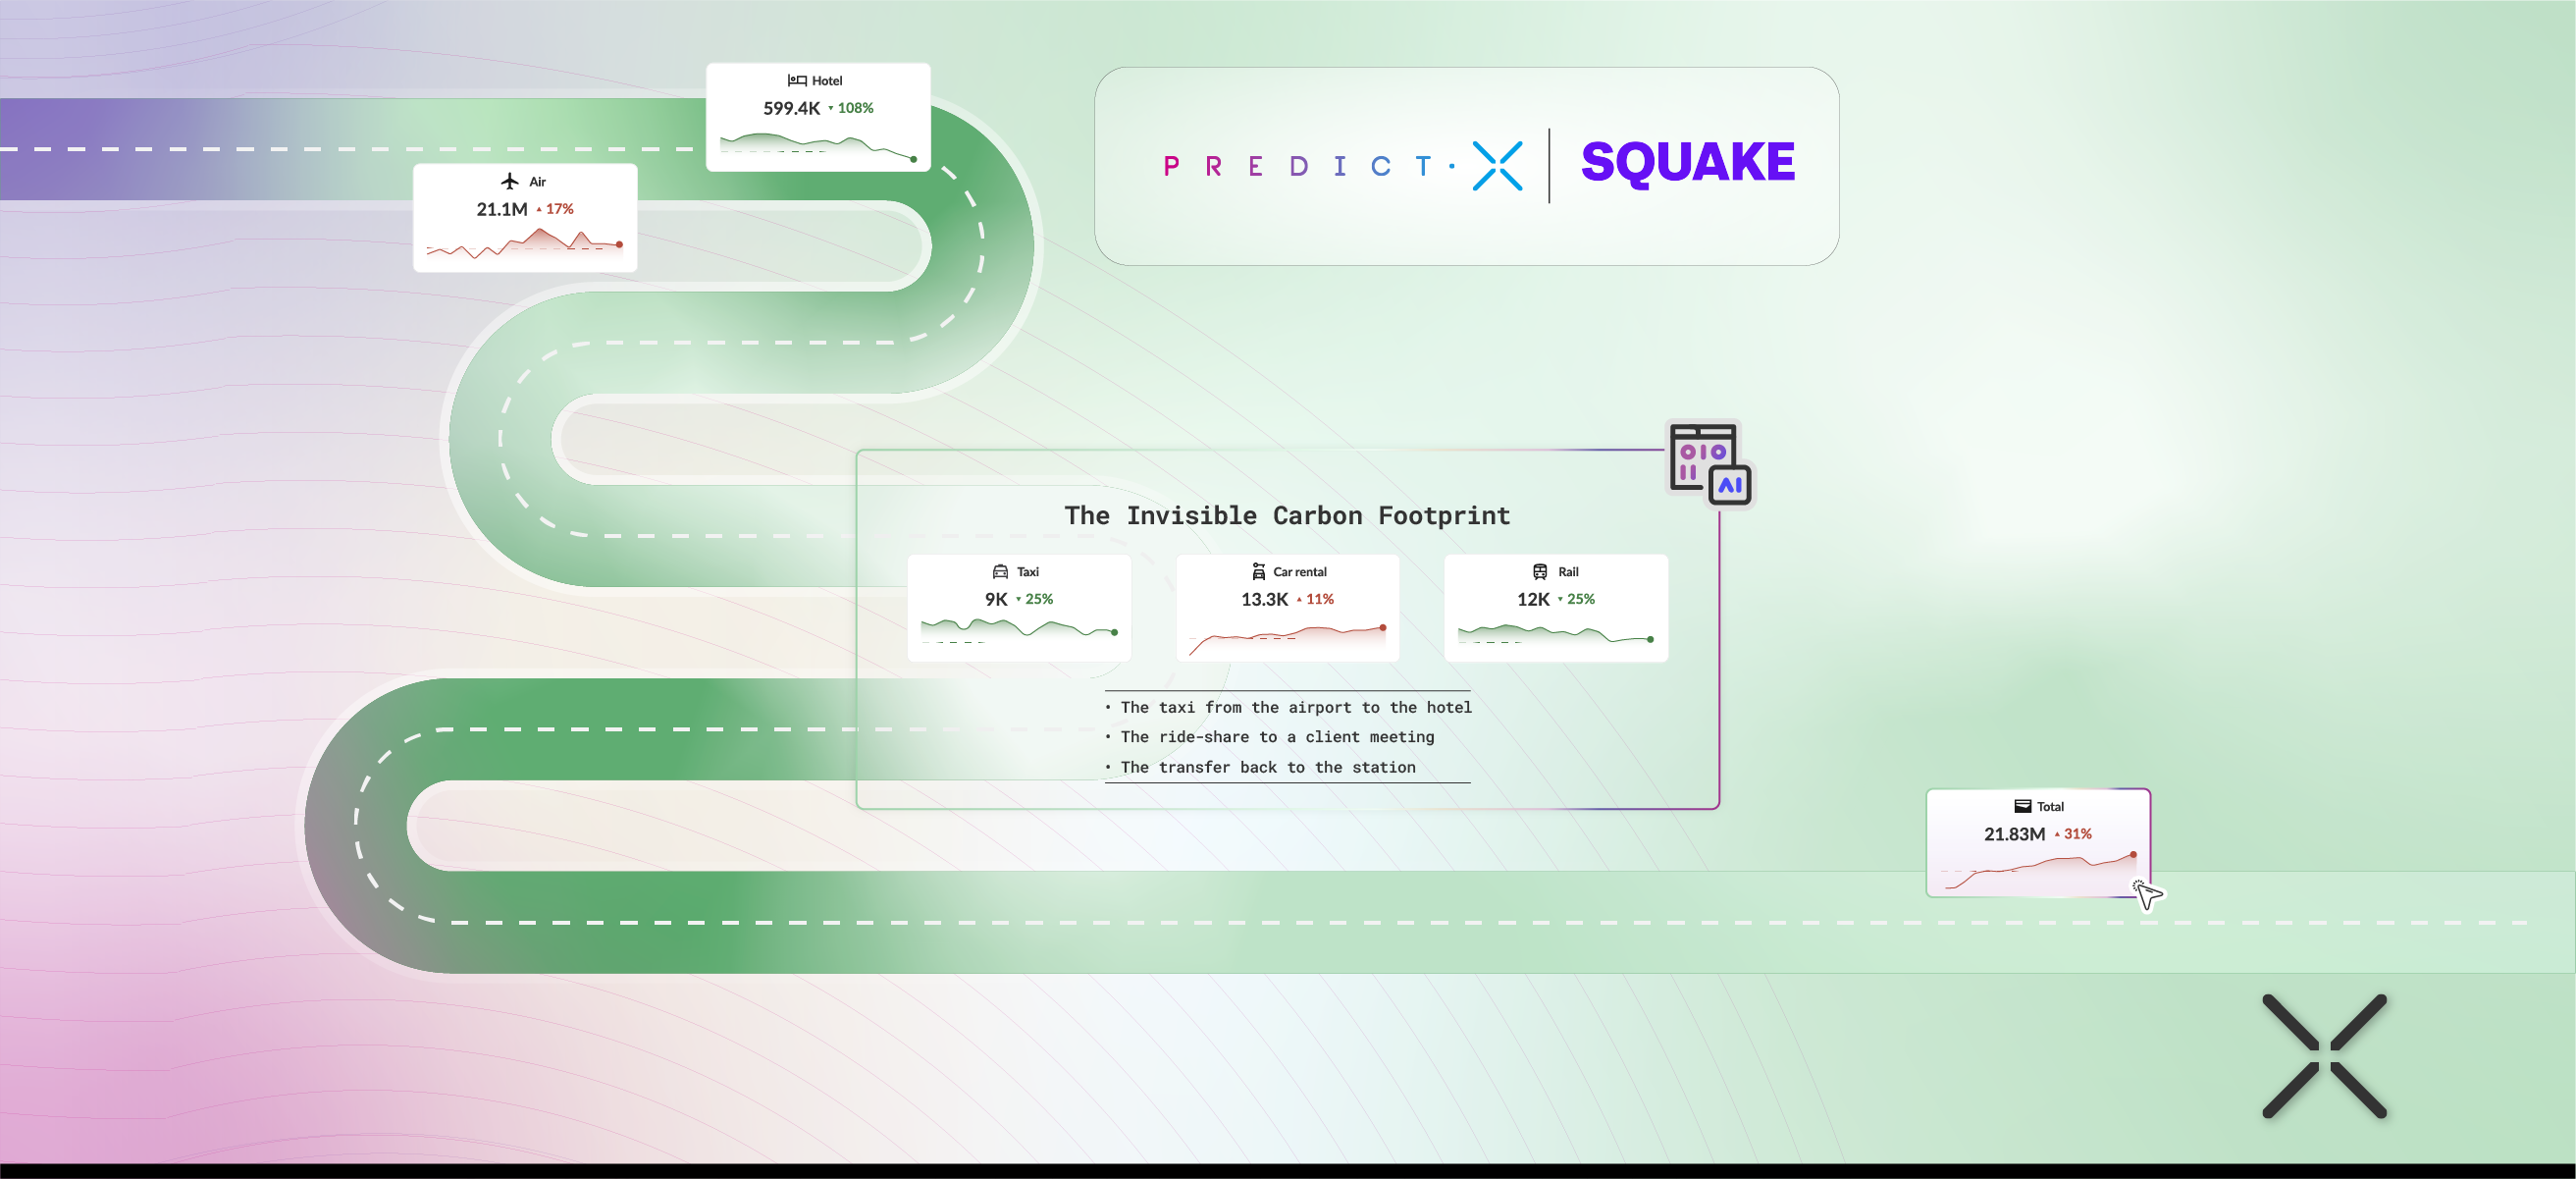
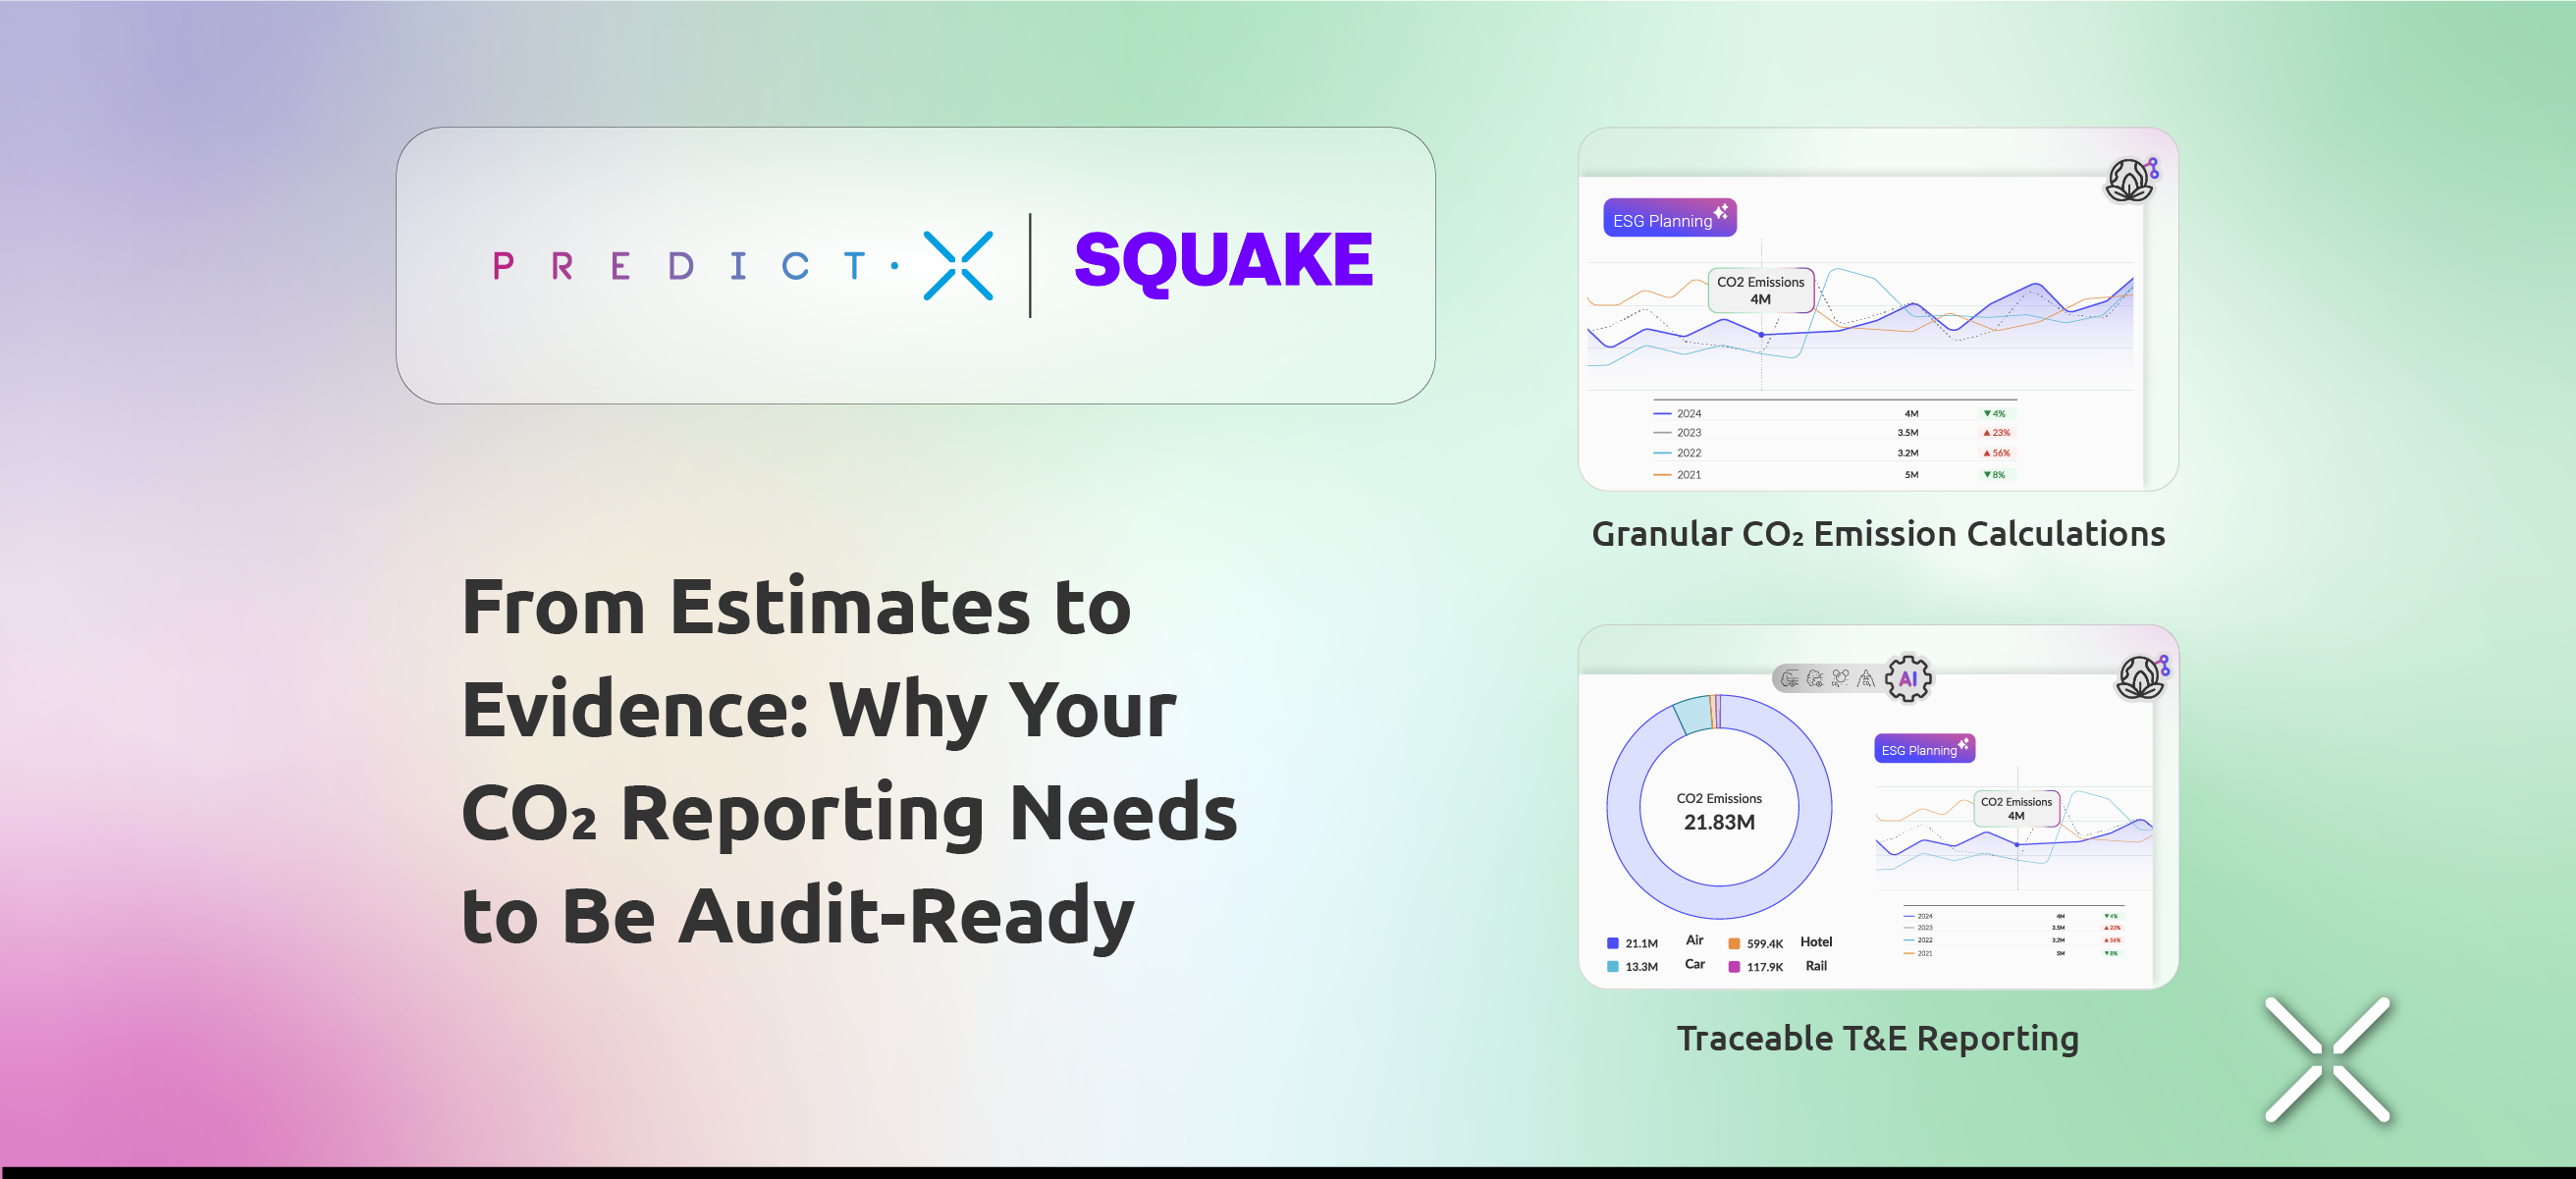
The PredictX 4-Layer Data Chain works by consolidating TMC feeds, hotel folios, rail operator APIs, and expense receipts into a single certified calculation engine, producing an immutable audit trail across every trip category.

Layering a carbon calculator on top of incomplete expense data does not fix the gap. The source data itself needs to be consolidated, cleansed, and connected to a certified methodology before any Scope 3 calculation is meaningful. The PredictX CSRD Scope 3 business travel emissions compliance guide sets out the full data chain requirements in detail.

The PredictX 4-Layer Data Chain consolidates fragmented travel and expense data sources into a single certified Scope 3 calculation engine, producing an audit-ready CO2e ledger across every trip category.

How the PredictX 4-Layer Data Chain Works: 4-Step Process for Audit-Ready Scope 3 Reporting A flow diagram showing the four-layer process by which PredictX consolidates TMC, hotel folio, rail, and expense data into an audit-ready Scope 3 CO2e ledger, from raw data consolidation through to immutable CSRD audit trail generation. Layer 1 Data Consolidation TMC + folios + rail + receipts Layer 2 Agentic AI Categorisation Tagging + enrichment Layer 3 Certified Calculation GHG Protocol + ISO 14083 Layer 4 Audit Trail Generation Immutable CSRD-ready ledger

How it works, step by step:

  1. Data Consolidation: TMC booking feeds, hotel folios, rail operator API connections, and expense receipts are ingested into a single unified T&E data pipeline.
  2. Agentic AI Categorisation: Agentic AI identifies and categorises unstructured ground transport receipts, applying vehicle type, distance estimates, and city-level fuel factors.
  3. Certified Calculation: Every trip category is calculated using GHG Protocol, ISO 14083, and CORSIA/EU ETS standards via the SQUAKE platform. Granular inputs replace spend-based averages.
  4. Audit Trail Generation: Every CO2e figure is attached to a traceable source record, producing an immutable ledger that is defensible under CSRD third-party assurance requirements.

The 4-Layer Data Chain: Step by Step

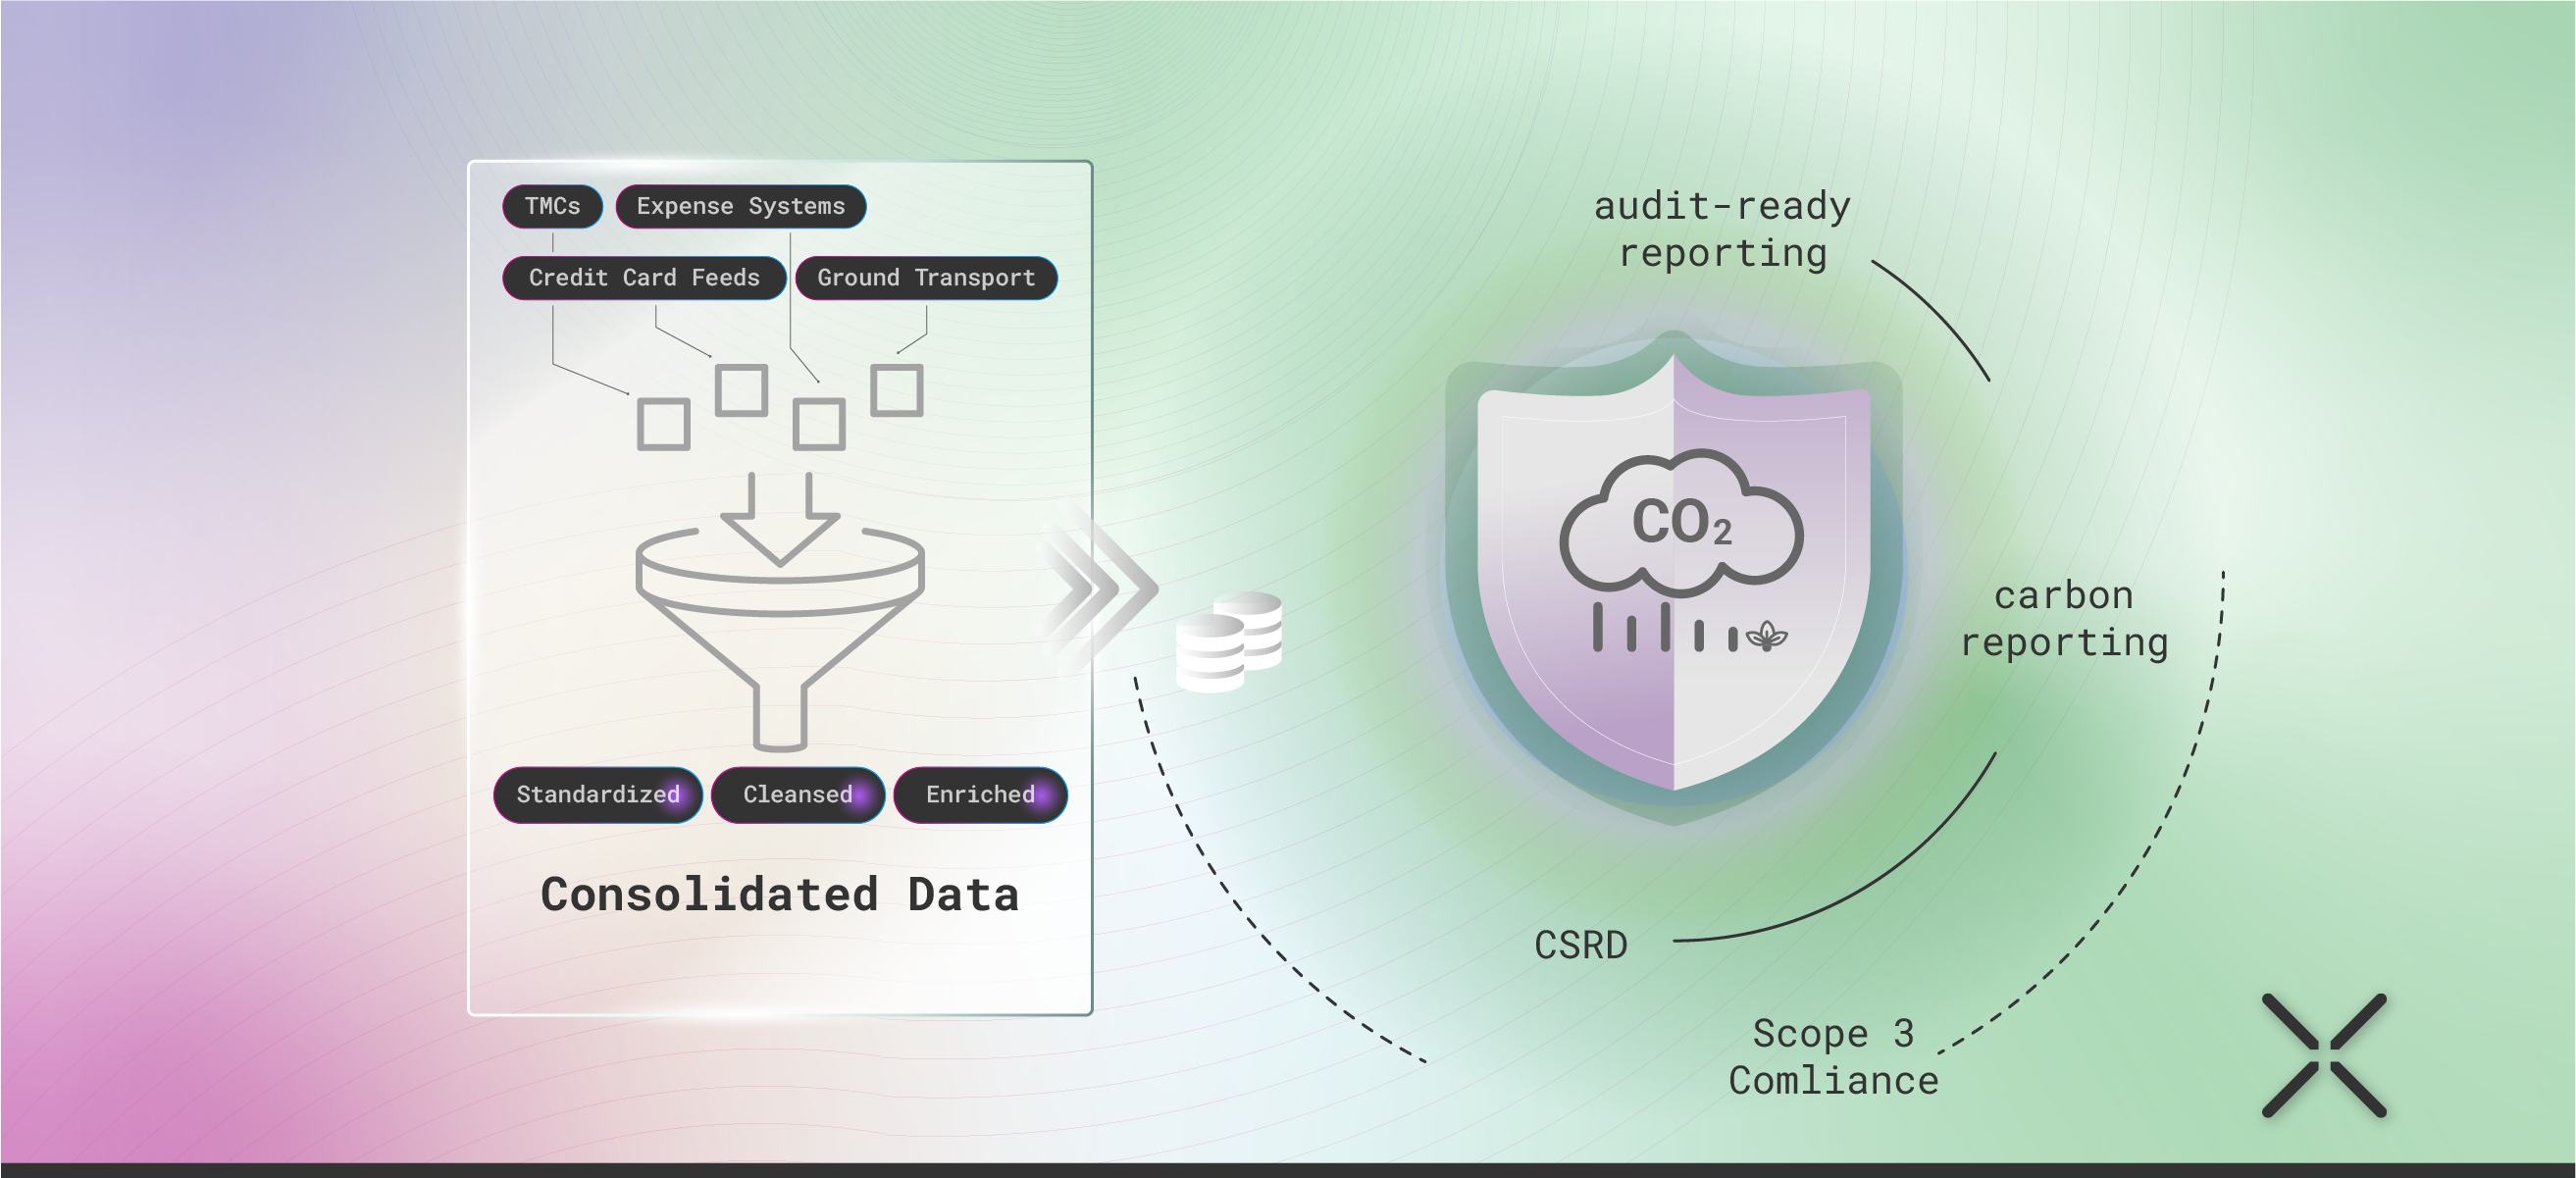
Layer 1: Data Consolidation. TMC booking feeds, hotel folios extracted from expense systems, rail operator API connections, and ride-share receipts are pulled into a unified T&E data pipeline. Structured and unstructured spend lines are ingested together.

Layer 2: Agentic AI Categorisation. Agentic AI identifies and categorises unstructured ground transport receipts that would otherwise remain as generic spend lines. Vehicle type, distance estimates, and city-level fuel factors are applied at this stage.

Layer 3: Certified Calculation. Every trip category is calculated using GHG Protocol, ISO 14083 (the international standard for greenhouse gas calculations from transport chains), and CORSIA/EU ETS standards via SQUAKE. Granular inputs replace spend-based averages: aircraft type, rail operator, cabin class, and regional grid mix.

Layer 4: Audit Trail Generation. Every CO2e figure is attached to a traceable source record with documented emission factors and calculation methods. The immutable audit trail makes outputs defensible under CSRD third-party assurance.

"It's about granular, real-time CO2 tracking. You need to see emissions across all activities (air, rail, car rental, hotel) broken down by traveller and business unit." Keesup Choe, CEO, PredictX

The 2025 Net-Zero Business Travel Playbook from PredictX and SQUAKE covers how to move from this data foundation to active CO2 reduction strategy and net-zero targets.

How does consolidated T&E data produce audit-ready Scope 3 reporting?

Consolidated Travel and Expense data produces audit-ready Scope 3 reporting by pulling hotel folios, rail feeds, and expense receipts into a single certified calculation engine that covers every trip category, not just flights.

PredictX, in partnership with SQUAKE, is built around exactly this integration. The PredictX and SQUAKE integration connects to rail operator APIs, extracts hotel folio data from expense systems, and uses agentic AI to categorise ground transport receipts that would otherwise be unstructured spend lines. The PredictX and SQUAKE product sheet for ESG compliance covers the full technical specification.

"Integrating with the technology and innovation leader in travel and expense data analytics is a natural step. Together, we're raising the bar for what enterprise clients can expect from sustainability tools, transforming data into meaningful action." Philipp von Lamezan, CEO and Co-founder, SQUAKE

The result is a complete corporate travel carbon reporting ledger where every trip category carries a traceable CO2e figure, ready for ESG performance management and net-zero strategy.

Scope 3 Travel Reporting Maturity Model

Use this framework to assess where your current programme sits and identify what the next step requires.

Scope 3 travel emissions reporting maturity model: four levels from flight-only to full T&E integration and CSRD audit readiness
Maturity Level What It Looks Like What Is Missing CSRD Ready?
Level 1: Flight-only Air travel via TMC feed; hotels and ground excluded All hotel, car rental, taxi, and rail emissions No
Level 2: Spend-based estimates Hotel and ground spend added via credit card or expense data Property identity, distance, fuel type, grid intensity No
Level 3: Distance-based with partial folios Rail and some hotel folios captured; car rental still spend-based Rental car fuel type, ride-share distance data Partial
Level 4: Full T&E integration All trip categories covered with certified methodology and immutable audit trail Nothing material Yes

Most organisations sit at Level 1 or Level 2. Moving to Level 4 requires a consolidated T&E data platform with certified CO2 emission calculations, not a standalone carbon footprint software tool.

Here is what the two main approaches deliver in practice:

Flight-only vs consolidated T&E travel emissions reporting: coverage, accuracy, and CSRD audit compliance compared
Approach Coverage Accuracy CSRD Compliant
Flight-only reporting via TMC feed Air travel only High for flights; zero for hotels and ground No, material categories missing
PredictX + SQUAKE consolidated T&E reporting Flights, hotels, rail, car rental, taxis, ride-share High across all categories via GHG Protocol and ISO 14083 Yes, with immutable audit trail

The difference between these two approaches is not a gap in ESG ambition. It is a gap in data architecture.

The PredictX and SQUAKE audit-ready CO2 reporting guide covers implementation steps, and the travel data and predictive analytics for net-zero targets resource connects this to longer-term decarbonisation strategy.

PredictX sustainability dashboard showing CO2e split across air, hotel, car rental, and rail categories with CSRD audit trail indicators
The PredictX sustainability dashboard breaks Scope 3 travel emissions down by trip category, with an immutable audit trail that satisfies CSRD third-party assurance requirements.

Calculate Your CSRD Audit Risk in 30 Seconds

Calculate Your CSRD Audit Risk in 30 Seconds

Estimate how much of your business travel carbon footprint is missing from your current Scope 3 report.

Estimated emissions you are currently missing

-- tCO2e

What this means for your CSRD report:
Enter your figures above to see your coverage gap.
Your gap is real. Close it before your auditor finds it.
Request a Trial →

How this calculator estimates your Scope 3 coverage gap

The calculator estimates the volume of business travel emissions missing from a flight-only Scope 3 report by applying two additional emission factors to your trip data.

Hotel emissions are calculated using the DEFRA baseline factor of 21.4 kg CO2e per hotel night, multiplied by the number of trips and average nights per trip. Ground transport emissions are estimated at 15% of reported flight CO2e per trip, based on the GHG Protocol Category 6 average ratio of ground transport to air travel emissions across enterprise programmes. Both figures are indicative estimates; actual emissions will vary based on property location, grid intensity, vehicle type, and fuel mix.

The result is the volume of tCO2e that is structurally absent from a flight-only Scope 3 report, expressed both as a total and as a percentage of the full trip footprint. This percentage is the figure that CSRD third-party assurers assess for materiality.

Key takeaway

Business travel emissions reports that only track flights are incomplete by design. Hotels and ground transport sit in fragmented expense systems that standard TMC feeds never reach. CSRD auditors will find those gaps. If your current report cannot answer how much your hotel stays in high-carbon grid regions contributed last quarter, you are not audit-ready. Consolidated T&E data with certified CO2 emission calculations is the only route to a defensible Scope 3 carbon report.

Your next CSRD audit will ask about hotels, ground transport, and cabin class data. Most current reports cannot answer those questions. Find out exactly what PredictX's corporate travel sustainability platform would surface in yours, and whether your current Scope 3 report would pass.

Frequently Asked Questions

What is Scope 3 Category 6 and does it include hotels?

Scope 3 Category 6 covers all business travel emissions from transportation and accommodation not owned by the reporting company, as defined by the Greenhouse Gas Protocol. Under the GHG Protocol, hotel stays are optional in Category 6 but recommended. Under CSRD sustainability reporting requirements, omitting hotels or ground transport creates a material gap that third-party assurers will flag. For any company subject to CSRD, the full trip must be reported.

Why do flight-only business travel emissions reports fail CSRD requirements?

Flight-only corporate carbon reports fail CSRD because the directive requires complete Scope 3 disclosure with third-party assurance, and hotels and ground transport are material emission categories. TMC booking data only captures managed air travel. Hotels booked outside corporate tools and ground transport paid personally by employees never enter that system. The data gap is structural, not accidental.

What is the GHG Protocol and why does it matter for calculating Scope 3 emissions?

The Greenhouse Gas Protocol is the globally dominant standard for measuring greenhouse gas emissions, and it defines how Scope 3 business travel calculations must be structured. Its Category 6 guidance requires flight, rail, car rental, and hotel emissions to be captured using fuel-based, distance-based, or spend-based methods in that order of accuracy. Most companies default to spend-based, the least accurate method, carrying a 30 to 40% variance.

What data do you need to calculate hotel emissions accurately for ESG reporting?

You need the specific property, the number of nights, the regional grid carbon intensity, and ideally HCMI-standard sustainability data from the hotel itself. Spend-only estimates carry a 30 to 40% accuracy variance. Grid intensity varies by a factor of ten or more across Europe, which means a spend-based average is almost always wrong depending on location. Automated carbon reporting tools that extract folio-level data close this gap.

How do you capture taxi and ride-share emissions in a corporate travel programme?

Distance-based calculation from expense receipt data is the most reliable method for travel carbon footprint tracking, with agentic AI used to identify and categorise unstructured ride-share receipts. Platforms like PredictX apply regional emission factors by city and vehicle type once receipts are tagged. Spend-based fallback is available where distance data cannot be extracted, but accuracy drops significantly.

Related Posts

February 10, 2026

The What-If Machine: Using Travel Data & Predictive Analytics to Model Your Path to Net-Zero Targets

Modeling your path to net-zero targets Use travel data & predictive analytics to simulate co₂ reduction strategies and test policies in a digital environment. Leverage consolidated travel & expense data to identify carbon hotspots and ensure your esg performance management is audit ready.
December 5, 2025

The Data Chain of Custody: Why Audit-Ready Reporting Begins with Consolidated T&E Data

This article explains the data-chain-of-custody crisis in T&E reporting. Learn why data consolidation & insights is essential and how PredictX delivers true, defensible audit-ready reporting for your CO2 figures.
November 19, 2025

PredictX x SQUAKE: Quantifying CO₂e Savings from Air-to-Rail Modal Shift for Audit-Ready CSRD and Scope 3

This blog introduces our essential guide on how to quantify 90% CO2e savings from modal shift. Learn how PredictX and SQUAKE provide audit-ready data for T&E reporting and accelerating net-zero targets.
October 29, 2025

Failing Audits? Get the PredictX Product Sheet: The Path to Auditable Corporate Travel Emissions

Download the PredictX Product Sheet to gain auditable, real-time CO₂ tracking and Agentic AI insights for your Scope 3 Emissions. Achieve ESG Compliance and accelerate Net-zero targets with precise Business Travel data.
November 5, 2025

The Scope 3 Mandate: Why CSRD Reporting Turns Business Travel Emissions into a Boardroom Issue

he new CSRD rules mandate Scope 3 Reporting for Business Travel. Discover why fragmented data is a compliance risk and how an integrated T&E Reporting system provides the Consolidated Travel & Expense Data needed for Corporate Accountability and Audit-Ready Reporting aligned with the GHG Protocol.
September 25, 2025

Putting Your Car Rental Emissions in the Driving Seat: A Smarter Approach to Sustainability

Discover how PredictX uses consolidated travel data and advanced analytics to transform fragmented car rental emissions data into actionable insights, helping you meet ESG reporting requirements and drive meaningful CO₂ reductions.
September 24, 2025

Beyond Flights: Your Guide to Tracking and Reducing Ground Transport Emissions

Why is tracking ground transport emissions important? Tracking ground transport is crucial for a complete view of your carbon footprint because it often represents a significant "last mile" blind spot in business travel. Including this data from taxis, ride-shares, and transfers is essential for accurate Scope 3 emissions reporting and meeting modern sustainability regulations.
September 19, 2025

The Invisible Carbon Footprint: Why Your ESG Reporting Is Incomplete

Your sustainability reporting is not complete without tracking the "last mile" of travel. Learn how PredictX and SQUAKE provide auditable data to master ground transport emissions, Scope 3, and ESG compliance.
September 15, 2025

The 2025 Playbook for Net-Zero Business Travel by PredictX & SQUAKE: Your 4-Step Guide to Actionable Sustainability

Ready to move from net-zero targets to achieving them? Learn how PredictX provides the data to transform your corporate travel sustainability strategy into a cornerstone of your ESG goals, including Scope 3 emissions reporting and compliance.
September 8, 2025

From Estimates to Evidence: PredictX x SQUAKE for Audit-Ready CO₂ Reporting

Are you still using estimates for your corporate travel emissions? It's time to move from approximation to auditable precision. Learn how the native integration between PredictX and SQUAKE delivers certified, granular CO₂ emission calculations, helping your financial institution ensure ESG compliance and confidently meet its corporate sustainability goals.
February 19, 2024

PredictX for Sustainability

Track CO2 emissions with PredictX. Improve carbon tracking and plan reduction strategies. Start today.
September 22, 2023

How To Promote Sustainability and Calculate Your Company's Carbon Footprint

Learn corporate travel sustainability, net-zero emissions, and effective strategies in this PredictX webinar.
June 14, 2024

How PredictX is Pioneering the Use of AI for Corporate Travel Sustainability

PredictX pioneers corporate travel sustainability by using AI to manage and reduce carbon footprints, transforming travel data into actionable environmental strategies.
May 12, 2024

Adhering to the CSRD: Shaping the Future of Corporate Travel Sustainability with PredictX

Discover how the CSRD transforms corporate travel sustainability and how PredictX helps meet these requirements with advanced analytics, real-time reporting, and comprehensive ESG metrics.
November 19, 2024

Unveiling PredictX’s Internal Carbon Pricing Tool: A Transformative Leap for Business Travel Sustainability

Sustainability is becoming a core focus for businesses, and PredictX’s new Internal Carbon Pricing (ICP) tool in the Corporate Travel Sustainability module offers a game-changing way to reduce emissions. This innovative solution enables companies to track carbon costs and incorporate them into decision-making, making sustainable business travel a reality. By adopting this approach, organizations can lead in environmental responsibility while driving impactful change across their operations.
 PredictX and SQUAKE partnership visual featuring a handshake, digital graphs, bar charts, symbolizing sustainable corporate travel solutions, CO₂ tracking, and auditable data analytics.
June 10, 2025

PredictX and SQUAKE Make ESG Sustainability Goals Measurable and Audit-Ready for Corporate Travel Management

The corporate travel landscape is experiencing a pivotal shift. With the heightened focus on sustainability, the demand for accurate data on CO₂ emissions is higher than ever. Businesses are rethinking their travel and expense strategies, striving to achieve their climate and corporate sustainability goals with auditable processes while maintaining operational efficiency. To meet these challenges head-on, PredictX and SQUAKE have united to deliver an innovative solution. Their strategic partnership is set to reshape the way organizations manage emissions, empowering them to make informed, sustainable decisions with confidence.
No items found.